This blog is open to any who wish to comment on Australian society, the state of the environment or political shenanigans at Federal, State and Local Government level.
So you think it’s OK to keep voting for your local Liberal or Nationals MP and return them to the federal parliament next year?
That all people on Centrelink income support need to do is pull up their socks and get on with it because many of those Coalition MPs have told their electorates that ‘the best welfare is a job’?
Perhaps it is time to pause and think about the possible relationship between states with low employment opportunities as well as high unemployment levels and states with high working-age suicide rates – and then consider the effect of those punitive welfare policies that first the Abbott and then the Turnbull governments have created or expanded.
Fines imposed on welfare recipients in a controversial work-for-the-dole scheme have soared to 300,000 in under two years, prompting renewed claims of poverty and hunger in Aboriginal communities.
Jobless people in remote Australia must work up to three times longer than other unemployed people to receive benefits.
The overwhelming majority of participants in the Community Development Programme (CDP) are Aboriginal.
The latest figures reveal about 54,000 financial penalties were slapped on participants in January, February and March alone for missing activities or being late.
"It's extraordinary," Australian National University researcher Lisa Fowkes said.
"Those 35,000 people have incurred more penalties than all of the 750,000 other Australians in the social security system.
"There is something really seriously wrong with the program, and that's showing up in these figures."
Unemployed people under the CDP must work 25 hours a week to receive welfare payments.
Intentional Self-Harm In
Aboriginal And Torres Strait Islander People
This section focuses on
Aboriginal and Torres Strait Islander suicide deaths for which the usual
residence of the deceased was in New South Wales, Queensland, South Australia,
Western Australia or the Northern Territory. .....
In 2015, 152 Aboriginal and Torres Strait Islander persons died as a result of suicide. The standardised death rate for Aboriginal and Torres Strait Islander persons was 25.5 deaths per 100,000 persons, compared to 12.5 deaths per 100,000 for non-Indigenous persons. Suicide deaths also accounted for a greater proportion of all Aboriginal and Torres Strait Islander deaths (5.2%) compared with deaths of non-Indigenous Australians (1.8%).
In the five years from
2011 to 2015, intentional self-harm was the leading cause of death for
Aboriginal and Torres Strait Islander persons between 15 and 34 years of age,
and was the second leading cause for those 35-44 years of age. The median age
at death for suicide in Aboriginal and Torres Strait Islander persons over this
period was 28.4 years, compared with 45.1 years in the non-Indigenous
population. Aboriginal and Torres Strait Islander females had a lower median
age at death than males (26.9 years for females compared with 29.0 years for
males).
Australia's population pyramid is not so balanced that it can afford to lose its teenagers and young adults to an early death from despair.
So why are we tolerating a federal govenment which does its best to grind down some of the most vulnerable amongst them - those who cannot easily find paid employment.
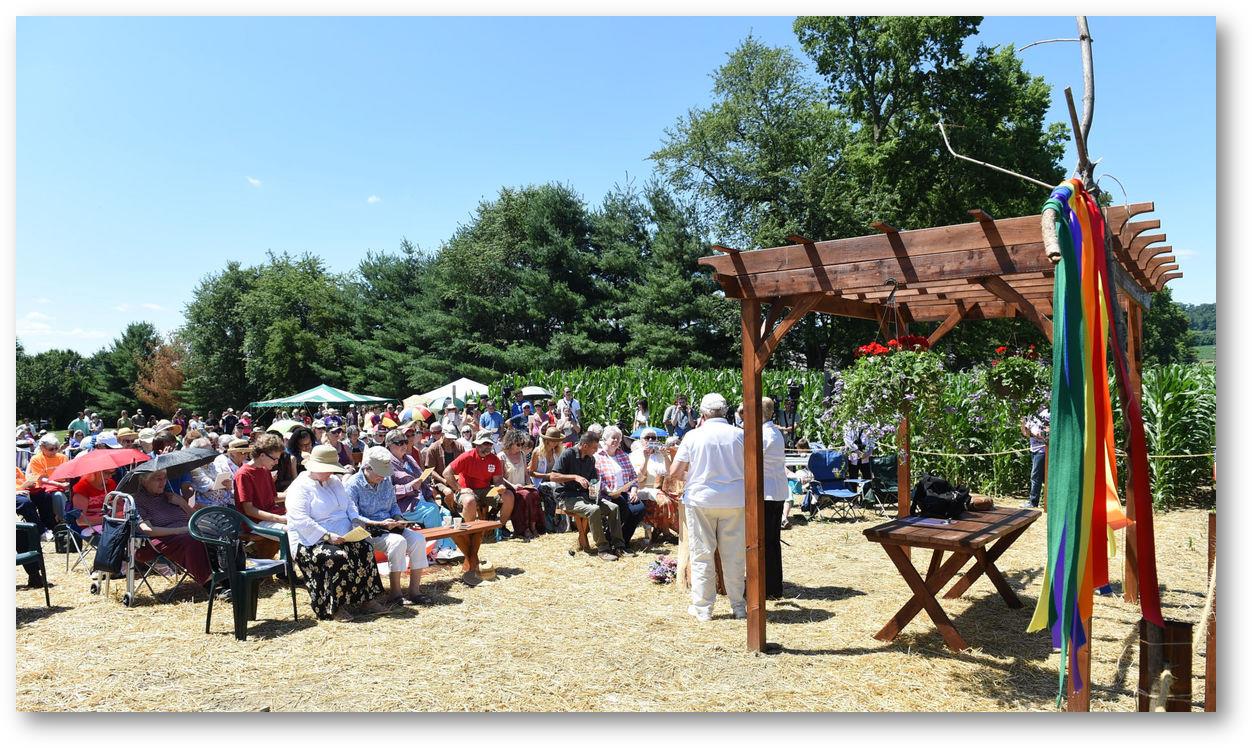
If the management team at Williams Partners was having flashbacks on Sunday, it was by design. The Oklahoma-based pipeline company has met stiff resistance to its proposed Atlantic Sunrise pipeline since it was first announced in 2014. On Sunday, hundreds of opponents of the project congregated in an outdoor chapel in Columbia, Pennsylvania on property owned by the Adorers of the Blood of Christ, an order of Catholic nuns. Among those in attendance were representatives from another order, the Sisters of Loretto, from Kentucky who helped defeat Williams’ Bluegrass pipeline in 2014….
Lancaster Against Pipelines, a grassroots group dedicated to stopping the nearly 200-mile natural gas transmission pipeline, constructed the chapel on a grove just feet from where the pipeline would cut through a corn field. The field and nearly cloudless blue sky above provided the backdrop for the simple wooden altar facing a few rows of wooden benches.
Williams Partners tried to stop the dedication. Last Thursday, the company submitted a 45-page emergency motion to a federal district judge in an attempt to take immediate possession of the property and get permission to deploy U.S. Marshals on the nuns and “any third parties authorized by the sisters to be on the property.”
It was a particularly brazen attempt on Williams’ part to get ahead of the legal process. The company was already scheduled to take the nuns to court later this month when it filed its emergency motion. The regulatory process is not complete yet either. The project has not yet received the permits from the state’s Department of Environmental Protection necessary to proceed with the pipeline.
Mark Clatterbuck, one of the group’s board members who helped construct the chapel, told the crowd that he thinks the company is getting nervous. He believes it understands that the chapel “is not sort of symbolic resistance, that it’s real and we’re not going away.”
“'If completed, it will go through more than 350 waterways, 220 wetlands and would permanently fragment over 44 interior forests,' said Malinda Harnish Clatterbuck, a local Mennonite pastor and cofounder of Lancaster Against Pipelines. '… We believe the collective damage to the Susquehanna watershed (and therefore the Chesapeake Bay) is irreparable, and that the state needs to intervene for the future of clean water and clean waterways in Pennsylvania.'”
People power at work on the NSW Liverpool Plains - well done to everyone over the years who attended protest events, emailed, wrote, phoned. posted, tweeted and/or made formal submissions objecting to Shenhua’s mining expansion plans.
Shenhua says it still plans to progress the Watermark coal mine in light of the NSW government $262m buy back of half its exploration licence.
Shenhua Australia Chairman Liu Xiang said the planning for the mine would continue on the remaining section of the licence “in line with the planning approvals” from both the state and federal governments.
The NSW government said despite the agreement, Shenhua's expired exploration licence had yet to be renewed.
“An application to amend the current renewal application to remove the relinquished area has been received,” a Department of Planning and Environment spokesman said.
“The relinquished area will be removed from the title and the consideration of the renewal application for the remainder of the licence will be considered as per normal procedures and in accordance with the Act.”
In a statement to The Leader, Shenhua expressed its “disappointment” regarding the NSW government’s stance on mining operations on black soil plains, “as it would prevent its efforts” to get its exploration licence “wholly renewed”.
While Shenhua believes it “would have been able to responsibly expand its existing Watermark Coal Mine”, it has “come to terms with the NSW Government’s decision to not allow any mining on the black soil plains”.
Liberal Member of the NSW Legislative Council, Don Harwin Minister for Resources, Minister for Energy and Utilities, and Minister for the Arts, Vice-President of the Executive Council
National co-ordinator for the Lock the Gate Alliance Phil Laird said anything less than the full cancellation of the project would not protect the farming systems.
"If we are going to hand over our best farming country to a coal mine that's owned by the Chinese Government, we've got to change our priorities," Mr Laird said.
"This coal mine is going to be 200 metres deep and its going to cut below the ridge line way below the level of the farm land and the aquifers.
"The impacts to those aquifers is unknown and the entire region depends on those aquifers for survival."
12/07/2017 | Press release | Distributed by Public on 12/07/2017 19:28
Voluntary Announcement- Announcement On Progress Of The Wate...
Hong Kong Exchanges and Clearing Limited and The Stock Exchange of Hong Kong Limited takes no responsibility for the contents of this announcement, makes no representation as to its accuracy or completeness and expressly disclaims any liability whatsoever for any loss howsoever arising from or in reliance upon the whole or any part of the contents of this announcement.
(a joint stock limited company incorporated in the People's Republic of China with limited liability)
(STOCK CODE: 01088)
VOLUNTARY ANNOUNCEMENT
ANNOUNCEMENT ON PROGRESS OF THE WATERMARK PROJECT
This announcement is made by China Shenhua Energy Company Limited (the "Company") on a voluntary basis. The purpose of this announcement is to keep the Shareholders and potential investors of the Company informed of the latest business development of the Group.
On 20 November 2008, the Company issued the Announcement in relation to Watermark Exploration Area Exploration License. Shenhua Watermark Coal Pty Limited ("Watermark Pty"), a wholly-owned subsidiary of the Company, entered into Exploration License with the state government of New South Wales, Australia (the "NSW Government"), pursuant to which Watermark Pty paid for the exploration license at a consideration of AUD299,900,000 and obtained the Watermark exploration area of approximately 195 square kilometers in aggregate.
On 29 June 2017, Watermark Pty reached an agreement with the NSW Government in relation to partial extension of the exploration license. Pursuant to the established policies of protection of agricultural activities on the black soil plains, the NSW Government withdrew the exploration license of approximately 100 square kilometres within Watermark exploration area and provided Watermark Pty with economic compensation amounting to AUD261,800,000, and accepted the application for the partial extension of the exploration license of non-black soil plains in Watermark exploration area. According to the agreement upon tendering in 2008, if the mining license of Watermark Pty is approved, then an additional AUD200,000,000 shall be paid to the NSW Government.
There are three planning open-cut mining areas, which are situated within the area of non-black soil plains, for the Watermark Pty Open-cut Coal Mine Project with recoverable reserves of approximately 290 million tonnes (JORC Standards), total designed raw coal production capacity of 10 million tonnes/year and designed service life of 24 years. The total investment amount of the project was approximately AUD1,470,000,000, among which 40% was contributed by Watermark Pty and 60% was financed by way of bank borrowings.
Up to now, the approval from the National Development and Reform Commission of the PRC, the approval for the environmental impact assessment from the Australian Federal Government and the approval from the Planning and Assessment Commission of the NSW Government have been obtained for the Open-cut Coal Mine Project. The environmental protection certification and mining rights license from the NSW Government will be applied for.
Watermark Pty will comply with the requirements of laws in Australia to promote the approval and construction of the Open-cut Coal Mine Project.
SHAREHOLDERS OF THE COMPANY AND POTENTIAL INVESTORS ARE ADVISED TO PAY ATTENTION TO INVESTMENT RISKS AND EXERCISE IN CAUTION WHEN DEALING IN THE SHARES OF THE COMPANY.
…..But Kenny knew better, cleverly revealing the real story: “a global warming pause”.
Wrong. There is no global warming pause, as has been widely and repeatedly made clear, for example, here, here and here. Even worse, the paper he referred to said nothing of the sort.
About five seconds into Kenny’s TV, ahem, “report”, he decided to stop being even slightly accurate. “What they’re saying here is that the warming they have on their graphs, on their modelling, is much higher than the warming that has actually occurred.”
The paper didn’t say this either.
Kenny then went on to quote repeatedly and triumphantly from the paper’s abstract, not the paper itself. Which is a bit weird. It’s like quoting from the back cover of a book, not the book itself. (The abstract of academic papers is typically publicly available, whereas the papers themselves are usually restricted to researchers or universities.) For such a huge, serious science story, wouldn’t you cite the actual paper? Unless, of course, you don’t have access to the paper. And if you don’t have access, have you actually read the thing?
Kenny quoted the last line of the paper’s abstract:
“We conclude that model overestimation of tropospheric warming in the early twenty-first century is partly due to systematic deficiencies in some of the post-2000 external forcings used in the model simulations.”
This, he said, meant that scientists were overstating temperatures. Hence the momentousness of his”story”. Problem is, the paper didn’t say this at all.
If he’d read the last line of the paper itself — and it’s questionable as to whether he read the paper at all — he would have read this:
“Although scientific discussion about the causes of short-term differences between modelled and observed warming rates is likely to continue, this discussion does not cast doubt on the reality of long-term anthropogenic warming.”
Kenny didn’t report this, though. If he had, he wouldn’t have much of a story. However, he did claim that the paper showed that climate scientists’ models were wrong, that temperatures were overstated and therefore climate change wasn’t such a problem.
Kenny is the earthly representative of his spiritual mentor, Andrew Bolt, who misreported the same story, but went one further, saying that the paper’s lead author, “leading alarmist Ben Santer, now admits the world isn’t warming as predicted by global warming models”.
Not only is Bolt’s report as untrue as Kenny’s — if not more so — but Santer has been at pains to make clear the opposite is the case. For example, he published a fact sheet to accompany the paper Kenny and Bolt reported on. Wait a moment, I here you say, there was a fact sheet?
Indeed. As Santer explained to me:
“The aim of the fact sheet was to reduce the likelihood of misinterpretation of key findings of our paper. But no matter how carefully or cautiously a paper is written, it is impossible to guard against wilful misrepresentation of results. Sadly, such wilful misrepresentation is now an expected outcome after each paper I publish.”…..
Apart from getting the names of two of the researchers right, little else Kenny said was.
As is evidenced by Kenny’s Heads Up segment posted on YouTube:
Benjamin D. Santer, John C. Fyfe, Giuliana Pallotta, Gregory M. Flato, Gerald A. Meehl, Matthew H. England, Ed Hawkins, Michael E. Mann, Jeffrey F. Painter, Céline Bonfils, Ivana Cvijanovic, Carl Mears, Frank J. Wentz, Stephen Po-Chedley, Qiang Fu, and Cheng-Zhi Zou
Published online in Nature Geoscience. DOI:10.1038/NGEO2973.
Question 1: What is the main issue that you look at in your paper?
Answer: Our paper looks at satellite and climate model estimates of global-mean changes in the temperature of the lowest layer of Earth’s atmosphere – the troposphere. It tries to understand why there are differences between modeled and observed tropospheric warming rates over the period of satellite atmospheric temperature measurements (January 1979 to December 2016). These differences have an interesting time signature. In the last two decades of the 20th century, differences between modeled and observed tropospheric warming were generally small. But during most of the early 21st century, the average warming in models was larger than in observations.
We asked whether such differences between modeled and observed warming rates could be explained by natural internal variability of the climate system. Natural internal variability arises from phenomena like El Niños, La Niñas, decadal oscillations in the Pacific,1 and the Atlantic Multidecadal Oscillation (AMO).
We found that natural internal variability can explain most of the relatively small differences between modeled and observed tropospheric warming in the last two decades of the 20th century, but can’t fully explain why model tropospheric warming is larger than in the satellite data during much of the early 21st century.
Question 2:What is your bottom-line finding?
Answer: The bottom line is that the differences between modeled and observed tropospheric warming contain useful diagnostic information. We use this information to test hypotheses about the causes of these warming rate differences. One hypothesis is that internal variability alone can explain why model tropospheric warming in the early 21st century is larger than in satellite data. Our findings suggest this hypothesis is very unlikely to be correct.
Based on our results, it is far more likely that the early 21st century differences between modeled and observed tropospheric warming rates are due to the combined effects of two factors: 1) Random differences2 1 Such as the closely-related Interdecadal Pacific Oscillation (IPO) and Pacific Decadal Oscillation (PDO). 2 We analyzed simulations performed with atmosphere-ocean models of the climate system, which produce their own random sequences of internal climate variability. In such models, there is no “synching up” (except by pure chance) between the random sequences of internal variability in the observations and in the model simulations. Different sequences of internal variability in “model world” and in the real world are not a scientific surprise – they are expected, and they can contribute to short-term differences between modeled and observed warming rates. 6/1/17 10:47 AM 2 in how modes of internal variability actually behaved in the real world and in the model simulations; and 2) The fact that some of the external cooling influences which affected “real world” temperature in the early 21st century were not accurately represented in the model simulations.
Question 3:What are the “external cooling influences” you are referring to in your paper?
Answer: Examples of such external cooling influences include a series of moderate volcanic eruptions, a long and unusually low minimum in the Sun’s energy output during the last solar cycle, and an uptick in particulate pollution from Chinese coal-fired power plants. The model simulations were performed before reliable, upto-date information became available about how these external cooling factors evolved in the early 21st century.3
Question 4:Do the problems in representing these external cooling influences point to systematic errors in how sensitive the models are to human-caused greenhouse gas (GHG) increases?
Answer: No, not at all. We are talking about known, well-studied problems with some of the external, climate-influencing “forcing factors” that were used in the model simulations. These problems have nothing to do with the issue of how sensitive models are to GHG increases.
Question 5:Haven’t some scientists claimed that the larger-than-observed model warming in the early 21st century is solely due to over-sensitive models?
Answer: Yes, such claims have been made and continue to be made. We tested the “over-sensitive models” claim in our paper, and found that it does not explain the actual differences between modeled and observed tropospheric warming behavior. Nor does a combination of “over-sensitive models” and natural internal variability plausibly explain the differences. None of our findings call into question the reality of long-term warming of Earth’s troposphere and surface, or cast doubt on prevailing estimates of the amount of warming we can expect from future increases in GHG concentrations.
Question 6:In a recent paper in Scientific Reports, you find that satellite measurements do not show any signs of “leveling off” of tropospheric warming over the past two decades. Aren’t those findings at odds with the findings of the Nature Geoscience paper?
Answer: No. The findings of the two papers are entirely consistent. The Scientific Reports paper compares the satellite tropospheric temperature trend over the past 20 years with many samples of 20-year trends obtained from model simulations of natural internal climate variability.4 Even though the most recent 20-year warming trend is smaller than in earlier parts of the satellite record,5 it is still significantly larger than the range of 20-year trends caused by internal climate variability alone. From our Scientific Reports study, there is no evidence that satellite data show “leveling off” of tropospheric warming in the last two decades.
The Nature Geoscience paper focuses on different model simulations. It looks at simulations of historical climate change, and asks whether differences between model-simulated and observed tropospheric warming 3 Consider a hypothetical climate model with perfect representation of all important physical processes in the real-world climate system. If such a model were used to simulate historical climate change, but the simulation left out important external cooling influences that affected the real world, the simulated historical warming would tend to be larger than observed. 4 Model estimates of natural internal variability were obtained from so-called “control runs”, with no year-to-year changes in GHGs, volcanic aerosols, the Sun’s energy output, or other external factors. 5 For reasons that are explained in the last paragraph of the answer to Question 2. 6/1/17 10:47 AM 3 could be due to different sequences of internal variability in the real world and in model world. It finds that internal variability alone cannot convincingly explain why models do a reasonable job capturing observed tropospheric temperature changes in the late 20th century, but not in the early 21st century. It also finds that “over-sensitive models” cannot explain the curious structure of model-versus-observed warming rate differences.
The key point here is that the two studies pose different scientific questions. The answers to these questions are complementary, not contradictory.
Question 7: What is the major remaining uncertainty in your study?
Answer: We think that the main uncertainty is in the model estimates of internal climate variability. We rely on these variability estimates to test the two hypotheses mentioned above – that differences between modeled and observed warming rates during much of the early 21st century could be due to: 1) internal variability alone; or 2) the combined effects of “over-sensitive models” and internal variability. If models systematically underestimated the size and the timescales of the major “real-world” internal variability modes, it would be less easy for us to rule out hypotheses 1 and 2.
The problem here is that satellite temperature records are relative short, and are a mixture of both internal variability and temperature responses to external factors (changes in GHGs, particulate pollution, the Sun, volcanic aerosols, etc.). Reliably teasing out the internal variability from such a short, mixed record is a tough job. To be clear: model control simulations6 can give us pure “unmixed” estimates of internal variability. Observations cannot, so there is some irreducible uncertainty in judging how well models capture key features of “real world” internal variability.
Previous work that we’ve done has not found a systematic low bias in model estimates of tropospheric temperature variability, but there is some evidence that current models might underestimate the timescale of the IPO. A lot more work needs to be done in comparing modeled and observed variability. We hope that our paper will provide impetus for such work.
Question 8: What are some of the major lessons you’ve learned?
Answer: One of the lessons learned is that “forcing matters”. Through the pioneering work of Susan Solomon and many others, we’ve learned a lot about the external influences that affected real-world temperature in the early 21st century. We now understand that if we systematically misrepresent these external influences in model simulations, we’ll see differences between modeled and observed warming rates. We need to do a better job understanding how these external influences actually changed in the real world, and we need to put our best estimates of these forcing factors into model simulations. This type of work is now happening.
Another valuable lesson learned is that “natural internal variability matters”, particularly when one is comparing modeled and observed temperature changes with different sequences of internal variability, and over short periods (1-2 decades). Many scientists (and many of the authors of the Nature Geoscience paper) have devoted years of their careers to the task of improving the understanding of internal variability.
These lessons will enable us to do two things. First, to more reliably separate internal variability and external influences in observed climate records. And second, to better quantify the relative contributions of internal variability and external influences to the differences between simulated and observed warming rates. The “lessons learned” will help us to better diagnose the causes of these differences.
FOOTNOTES
1 Such as the closely-related Interdecadal Pacific Oscillation (IPO) and Pacific Decadal Oscillation (PDO).
2 We analyzed simulations performed with atmosphere-ocean models of the climate system, which produce their own random sequences of internal climate variability. In such models, there is no “synching up” (except by pure chance) between the random sequences of internal variability in the observations and in the model simulations. Different sequences of internal variability in “model world” and in the real world are not a scientific surprise – they are expected, and they can contribute to short-term differences between modeled and observed warming rates.
3 Consider a hypothetical climate model with perfect representation of all important physical processes in the real-world climate system. If such a model were used to simulate historical climate change, but the simulation left out important external cooling influences that affected the real world, the simulated historical warming would tend to be larger than observed.
4 Model estimates of natural internal variability were obtained from so-called “control runs”, with no year-to-year changes in GHGs, volcanic aerosols, the Sun’s energy output, or other external factors.
5 For reasons that are explained in the last paragraph of the answer to Question 2.
Sacked former Australian prime minister and current Liberal MP for Warringah Tony Abbott has finally offered proof that he renounced his British citizenship on Tuesday 12 October 1993.
Why did it take him so long to offer this proof that he had done so?
Perhaps because the timeline below shows that he appears to have done so solely in order to gain Liberal Party preselection in an upcoming by-election in the federal seat of Warringah.
In this Abbott followed an established pattern of behaviour – only having applied for Australian citizenship some twenty years after arriving in Australia in order to facilitate his application for a Rhodes Scholarship in 1981.
And the reason Abbott has chosen to release renouncement proof at this particular time?
For the real reason look no further than the rumour that he has lost control of the numbers and will inevitably face a preselection challenge ahead of next year’s federal election. Therefore the reigniting of the dual citizenship debate and questions concerning his own eligibility to sit in parliament left him politically vulnerable within his own party branch.
TIMELINE
13 March 1993
Federal general election held. Tony Abbott rumoured to have failed to find Liberal Party support to stand at this election.
IT has been a special week for Tony Abbott. The man trying to sell the monarchy — he is executive director of Australians for Constitutional Monarchy has had his product in town. But Abbott has other things on his mind as well. He is planning to run for preselection for the safe Liberal federal seat of Warringah, being vacated by Michael MacKellar.
Mr SPEAKER —I inform the House that on 14 January 1994 I received a letter from the Hon. James Joseph Carlton resigning his seat as the member for the electoral division of Mackellar. I am also aware that the Hon. Michael MacKellar, honourable member for Warringah, has indicated his intention to resign from parliament on Friday, 18 February 1994. Considerationis being given to possible dates for the by-elections, and I am consulting with party leaders on this matter. I will inform the House in due course of the dates which I have fixed for the by-elections.
Mr SPEAKER —……I have considered all the comments made. I now inform the House that, subject to the receipt of Mr MacKellar's resignation on 18 February, it is my intention to issue writs for the by-elections in Mackellar and Warringah on that day. Dates in connection with the by-elections will be as follows: issue of writs, Friday, 18 February 1994; close of rolls, Friday, 25 February 1994; nominations, Tuesday, 1 March 1994; polling, Saturday, 26 March 1994; and return of writs, on or before Friday, 27 May 1994.
Tony Abbott wins preselection for the federal seat of Warringah. At this point he has been eligible to stand for election to the federal parliament for just under nineteen weeks.
North Coast Voices no longer allows the Facebook Button sited at the end of each blog post to activate when it is clicked on by a reader.
This button has been deactivated because it has become clear that Facebook Inc. is not now and has never been a corporation genuinely committed to principles of digital privacy and security of Internet users' personal information and other associated data.
Unfortunately, because Blogger installs this button as part of a set, Gmail, Blog This!, Twitter, Pin Interest and Google + have also been deactivated and, we apologise to readers who may use these features.
The Universal Declaration of Human Rights Article 19
Everyone has the right to freedom of opinion and expression; this right includes freedom to hold opinions without interference and to seek, receive and impart information and ideas through any media and regardless of frontiers.
[Adopted and proclaimed by United Nations General Assembly resolution 217 A (III) of 10 December 1948]
Hi! My name is Boy. I'm a male bi-coloured tabby cat. Ever since I discovered that Malcolm Turnbull's dogs were allowed to blog, I have been pestering Clarencegirl to allow me a small space on North Coast Voices.
A false flag musing: I have noticed one particular voice on Facebook which is Pollyanna-positive on the subject of the Port of Yamba becoming a designated cruise ship destination. What this gentleman doesn’t disclose is that, as a principal of Middle Star Pty Ltd, he could be thought to have a potential pecuniary interest due to the fact that this corporation (which has had an office in Grafton since 2012) provides consultancy services and tourismbusiness development services.
A religion & local government musing: On 11 October 2017 Clarence Valley Council has the Church of Jesus Christ Development Fund Inc in Sutherland Local Court No. 6 for a small claims hearing. It would appear that there may be a little issue in rendering unto Caesar. On 19 September 2017 an ordained minister of a religion (which was named by the Royal Commission into Institutional Responses to Child Sexual Abuse in relation to 40 instances of historical child sexual abuse on the NSW North Coast) read the Opening Prayer at Council’s ordinary monthly meeting. Earlier in the year an ordained minister (from a church network alleged to have supported an overseas orphanage closed because of child abuse claims in 2013) read the Opening Prayer and an ordained minister (belonging to yet another church network accused of ignoring child sexual abuse in the US and racism in South Africa) read the Opening Prayer at yet another ordinary monthly meeting. Nice one councillors - you are covering yourselves with glory!
An investigative musing: Newcastle Herald, 12 August 2017: The state’s corruption watchdog has been asked to investigate the finances of the Awabakal Aboriginal Local Land Council, less than 12 months after the troubled organisation was placed into administration by the state government. The Newcastle Herald understands accounting firm PKF Lawler made the decision to refer the land council to the Independent Commission Against Corruption after discovering a number of irregularities during an audit of its financial statements.The results of the audit were recently presented to a meeting of Awabakal members. Administrator Terry Lawler did not respond when contacted by the Herald and a PKF Lawler spokesperson said it was unable to comment on the matter. Given the intricate web of company relationships that existed with at least one former board member it is not outside the realms of possibility that, if ICAC accepts this referral, then United Land Councils Limited (registered New Zealand) and United First Peoples Syndications Pty Ltd(registered Australia) might be interviewed. North Coast Voices readers will remember that on 15 August 2015 representatives of these two companied gave evidence before NSW Legislative Council General Purpose Standing Committee No. 6 INQUIRY INTO CROWN LAND. This evidence included advocating for a Yamba mega port.
A Nationals musing: Word around the traps is that NSW Nats MP for Clarence Chris Gulaptis has been talking up the notion of cruise ships visiting the Clarence River estuary. Fair dinkum! That man can be guaranteed to run with any bad idea put to him. I'm sure one or more cruise ships moored in the main navigation channel on a regular basis for one, two or three days is something other regular river users will really welcome. *pause for appreciation of irony* The draft of the smallest of the smaller cruise vessels is 3 metres and it would only stay safely afloat in that channel. Even the Yamba-Iluka ferry has been known to get momentarily stuck in silt/sand from time to time in Yamba Bay and even a very small cruise ship wouldn't be able to safely enter and exit Iluka Bay. You can bet your bottom dollar operators of cruise lines would soon be calling for dredging at the approach to the river mouth - and you know how well that goes down with the local residents.
A local councils musing: Which Northern Rivers council is on a low-key NSW Office of Local Government watch list courtesy of feet dragging by a past general manager?
A serial pest musing: I'm sure the Clarence Valley was thrilled to find that a well-known fantasist is active once again in the wee small hours of the morning treading a well-worn path of accusations involving police, local business owners and others.
An investigative musing: Which NSW North Coast council is batting to have the longest running code of conduct complaint investigation on record?
A which bank? musing: Despite a net profit last year of $9,227 million the Commonwealth Bank still insists on paying below Centrelink deeming rates interest on money held in Pensioner Security Accounts. One local wag says he’s waiting for the first bill from the bank charging him for the privilege of keeping his pension dollars at that bank.
A Daily Examiner musing: Just when you thought this newspaper could sink no lower under News Corp management, it continues to give column space to Andrew Bolt.
A thought to ponder musing: In case of bushfire or flood - do you have an emergency evacuation plan for the family pet?
An adoption musing: Every week on the NSW North Coast a number of cats and dogs find themselves without a home. If you want to do your bit and give one bundle of joy a new family, contact Happy Paws on 0419 404 766 or your local council pound.
When making comment defamatory statements, racist remarks, hate speech, incitement to violence, gratuitous insults, obscenities, sexual innuendo, active matters before the courts and linking to commercial products/promotions should be avoided.
Trolling will not be tolerated. Spam will not be accepted.
The blog administrator reserves the right to reject comments which ignore this policy.