Showing posts with label statistics. Show all posts

Sunday 26 May 2024

Suicide is a distressing subject and one that is linked in many kitchen table conversations with Centrelink income support programs. It appears that such a link may exist


The Guardian, 22 May 2024:


More than 30% of people who took their lives in 2019 were on welfare, AIHW says


The Australian Institute of Health and Welfare has just released some data that shows more than 30% of suicides in 2019 were people on the disability support pension (DSP) and newstart – despite being just 5.7% of the population.


During 2019, the most recent pre-Covid pandemic year, the age-standardised suicide rate among males who received unemployment payments was 2.8 times that of the male Australian population comparison. For females, it was 3.3.


During the same year, unemployment recipients accounted for approximately 20% of all suicide deaths among Australian males and females (across the same age range 15-66 years). Those on DSP were 14.5%.


The DSP recipient and Antipoverty Centre spokesperson, Kristin O’Connell, said:


The new figures on welfare recipient deaths by suicide are chilling, but reflect my all-too-frequent experiences supporting people who are planning to or have made an attempt as a result of dealing with “mutual” obligations or poverty.


Every government decision to leave us in poverty and subject people to abuse through “mutual” obligations is a decision that kills.


In 2020, Australia’s Mental Health Think Tank said the fastest and most effective thing the government could do to ease the mental health crisis was to keep the jobseeker payment at the poverty line.


The Morrison government plunged people back into deep poverty, and despite their claims to offer “cost of living relief” the Albanese government has continued the brutal welfare policies that led to these alarming suicide rates and widespread harm in our communities.


The wider picture also supports the assertion that welfare recipients of workforce age as a cohort are experiencing higher levels of suicide than the Australian population and, within that cohort those receiving disability or unemployment income support show the highest suicide rates. With a higher suicide rate than the general population continuing into old age for those receiving disability income support.


Australian Institute of Health and Wellbeing, Suicide & self-harm monitoring, Supporting people who experience socioeconomic disadvantage: Deaths by suicide among Centrelink income support recipients, retrieved 22 May 2024:


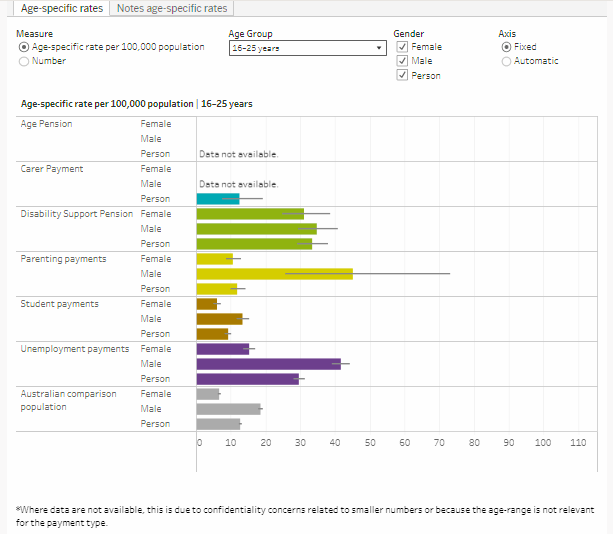
Age-specific rates of suicide among those who received income support payments between 2011 and 2021


Click on images to enlarge


AIHW, 15 August 2023:


Deaths by suicide, by socioeconomic areas


 From 2001 to 2022, age-standardised suicide rates were highest for those who lived in the lowest socioeconomic areas (most disadvantaged areas), and generally decreased as the level of disadvantage lessened.


In 2022, the suicide rate for people living in the lowest socioeconomic (most disadvantaged) areas (18.4 deaths per 100,000 population; Quintile 1) was more than twice that of those living in the highest socioeconomic (least disadvantaged) areas (8.2 deaths per 100,000 population; Quintile 5). Similarly, the number of deaths by suicide generally declined as socioeconomic disadvantage decreased.


Overall, age-standardised suicide rates increased for those living in the lowest socioeconomic areas (Quintile 1); from 14.0 deaths per 100,000 population in 2001 to 18.4 deaths per 100,000 population in 2022. In contrast, smaller change was observed for those living in the higher socioeconomic areas (Quintiles 4 and 5). [my yellow highlighting]


The Coronavirus Supplement was introduced in April 2020 and abolished in April 2021. Then COVID-19 Disaster Payments were announced in June 2021 and withdrawn in November 2021 placing increased financial stress on up to 2 million people. The Reserve Bank Cash Rate Target began to rise on 4 May 2022 and kept on rising - swiftly exacerbating a cost-of-living squeeze into an escalating crisis.


Although the causes of individual suicides can be complex, it is hard to resist seeing an economic policy correlation with the rising suicide rate between 2021 and 2022. It is also hard to avoid viewing entrenched poverty as being heavily influenced by federal income support policy decisions.


Monday 13 May 2024

Fifth Annual NSW Statewide Street Count of homeless people sleeping rough - results for the Northern Rivers region from Clarence Valley to the NSW-Qld border


TheEcho, 10 May 2024:


Byron Shire topped the state with a 16 per cent increase in rough sleepers, but the count also showed significant increases in numbers across Tweed, Ballina and Lismore shires.


While Sydney has remained stable with a one per cent increase it is the regional areas experiencing the biggest surge in homelessness in the past year. The 2024 street count found 2,037 people sleeping rough in 2024 compared to 1,623 people last year.


The sobering street count figures again paint a harrowing picture of homelessness and street sleeping across our state.,’ said Minister for Homelessness Rose Jackson.


While levels of street sleeping have stabilised in Sydney, we are still seeing an unprecedented increase of homelessness in many of our regional towns. We don’t just need data to tell us this – our regional communities are feeling this every day.’


The impact of climate disasters like the 2019-20 Black Summer bushfires, the 2022 floods, the rising interest rates, cost of living pressures and a shortage of rental homes are just some of the factors that are continuing to drive homelessness and street sleeping.


It is important to note that these are just the people sleeping on the street and in their cars, they do not reflect the number of people who are homeless and for example are staying with family or sleeping on friend’s couches etc.


Lismore saw an increase of rough sleepers jump from 40 in 2023 to 64 in 2024. Tweed Valley went from 145 to 174 in 2024, Ballina went from 30 to 63 and Byron Shire went from 300 to 348.....


Read the full article at:

https://www.echo.net.au/2024/05/byron-shire-sees-biggest-increase-in-rough-sleepers/


According to NSW Government Communities & Justice, 2024 NSW Statewide Street Count: Technical Paper, published on 8 May 2024:


Street counts took place between 1 February and 1 March 2024, in more than 400 towns and suburbs in 76 local government areas (LGA) across NSW.


Half of the counts took place in the evening, scheduled between 10:00pm and 3:00am, with the remaining half occurring in the morning between 3:30am and 9am.


Over 300 local organisations either consulted in the planning phase or participated in the delivery of street counts. Partners included Community Housing Providers, local councils and Specialist Homelessness Services, as well Aboriginal organisations, Local Health Districts, local community groups, and Police.


In 2024 in the Northern Rivers region local government areas (LGAs) with the largest decreases in people sleeping rough were:


Richmond Valley - 3 rough sleepers as of 22.02.24 at 5 locations. Down from 19 persons in 2023.

Clarence Valley - 58 rough sleepers as of 20.02.24 at 6 locations. Down from 69 persons in 2023.


As for the other five LGAs:


Kyogle Shire - had no rough sleepers as of 23.02.24 and zero persons in 2023

Ballina Shire - 63 rough sleepers as of 28.02.24 at 6 locations. Up from 30 persons in 2023

Lismore City - 64 rough sleepers as of 23.02.24 at 5 locations. Up from 40 persons in 2023

Tweed Valley - 174 rough sleepers as of 27.02.25 at 15 locations. Up from 145 persons in 2023

Byron Shire - 348 rough sleepers as of 29.02.24 at 9 locations. Up from 300 persons in 2023.


Across all 400 NSW sites counted in February 2024 there were 2,037 people considered homeless and sleeping rough. This represents a 26 per cent (414 person) increase compared to 2023.


Thursday 25 April 2024

North-east NSW coastal waters since 1850: a 'hot spot' for shark numbers


There are 8 real-time, satellite-linked VR4G listening stations deployed in approximately 10 to 12 metres depth of water approx. 500 metres offshore along the stretch of coastal waters off the Northern Rivers region in north-east New South Wales.


These listening station buoys are located at:

Kingscliff Beach, Tweed Heads

Clarkes Beach, Byron Bay

Lennox Point, Lennox Head

Sharps Beach, Ballina

Lighthouse Beach, Ballina

Main Beach, Evans Head

Main Beach, Yamba.


VR4G listening station off Lighthouse Beach, Ballina

IMAGE: NSW DPI Shark Smart


In 2023 the total number of shark detections at each of these 8 listening buoys were:

Kingscliff Beach - 305 (302 Bull Sharks & 3 White Sharks)

Clarkes Beach - 409 (213 White Sharks & 196 Bull Sharks)

Lennox Point*         | These 3 sites combined

Sharps Beach*        | 2,026 detections of

Lighthouse Beach* | 1,175 Bull, 755 White & 116 Tiger sharks

Main Beach, Evans Head - 3,135 (3,031 Bull Sharks & 96 White Sharks)

Main Beach, Yamba - 17,501 (17,306 Bull Sharks, 103 White Sharks & 2 Tiger Sharks).


Although in 2023 Yamba might have been the main contender for the title of shark capital of New South Wales, particularly in the months of April to August, there have been zero fatal shark attacks in Yamba river or ocean waters since 1850 and, only 37 injuries resulting from contact with a shark recorded by the Australian Shark Incident Database in that same 174 year period.


As for the entire coastline of north-east NSW along with its saltwater river mouths, from the Clarence Valley up to the NSW-Qld border, there have been est. 361 interactions with sharks resulting in injury since 1850, including est. 37 deaths.

Monday 22 April 2024

Newspoll April 2024 sees little wind in political parties' sails


Federal Primary Voting Intent:


ALP 33 (+1)


L/NP Coalition 38 (+1)


Greens 12 (-1)


One Nation 7 (0)


Other 10 (-1)


Federal Two Party Preferred Prediction:


Click on image to enlarge


ALP 51 (0)


L/NP Coalition 49 (0)


Better Prime Minister:


Click on image to enlarge


Albanese 48 (0)


Dutton 35 (+1)


Net Approval Rating


Anthony Albanese:  -6 (+1) 


Peter Dutton:  -15 (0) 


Newspoll was conducted by YouGov on Monday 15 to Friday 19 April 2024 and survey pool was 1,236


Thursday 18 April 2024

When will men stop blaming the ME TOO Movement for women's present outrage? EVERY SINGLE FEMALE in Australia was born into a world where all women are always vulnerable & unsafe and we absorbed this fact with the air we breathe


The  Me Too Movement began in the United States around 2006 and in 2017 the #meetoo hashtag went viral when actress Alyssa Milano tweeted ‘me too’ in the United States and in Australia journalist Tracy Spicer invited women to tell their story after the Weinstein scandal broke. 

However, the female experience in Australia had always been hiding in plain sight from those in authority and ever keenly felt by women & girls who had experienced physical violence and/or sexual assault in the home, in the workplace or in public spaces.

By way of example.


First the murders......


Now the sexual assaults/rapes......


2022

Sexual Assault Reported To Police

According to ABS Recorded Crime – Victims data, in Australia in 2022: 

32,100 sexual assaults were recorded, with 5 in 6 (84% or 27,000) perpetrated against females the rate of sexual assault was higher for females (206 per 100,000), than males (39 per 100,000) there was significant variation in sexual assault rates between states and territories. ACT had the lowest rate of sexual assaults (71 per 100,000 persons) while NSW had the highest rate (152 per 100,000) (ABS 2023a)..... There was a 43% increase in the rates of police-recorded sexual assault for women between 2010 and 2022.[Australian Government, Australian Institute of Health and Welfare (AIHW), 12 April 2024]  


2019

Sexual Assault

In 2019 there were 26,892 victims of sexual assault in Australia, an increase of 2% from the previous year. This was the eighth consecutive annual increase and the highest number for this offence recorded in a single year. After accounting for population growth, the victimisation rate has also increased annually over this eight-year period from 83 to 106 victims per 100,000 persons.

For victims of sexual assault in 2019:

  • The majority (83%) were female (22,337 victims)
  • Around two-thirds (67%) occurred in a residential location (17,395 victims)
  • A third were FDV-related (8,985 victims)
  • Almost all (95%) did not involve a weapon (25,583 victims)
[ABS, Victims of Crime Australia 2019, 9 July 2020] 


2000

Summary of Findings
 

There were 2,804 male and 12,396 female victims of sexual assault. The highest victimisation rates were recorded for males aged 0–14 years and for females aged 15–19 years, with 61% of all victims aged 19 years or younger. Similar proportions of male and female victims knew the offender (64% of male victims and 61% of female victims), and for both sexes approximately one-quarter of all offenders were family members. Almost two-thirds (64%) of all sexual assaults occurred in a residential location and almost all sexual assaults did not involve weapon use (98%). Less than half (41%) of all sexual assault investigations were finalised within 30 days of the offence becoming known to police, and of these 58% resulted in an offender being proceeded against. [ABS, Recorded Crime Australia 2000, 30 May 2001]


1998

Most victims of sexual assault were female (80%). Almost half (47%) were females aged under 20 years. The total number of sexual assaults recorded was 14,568 at a rate of 78 for every 100,000 people. The highest victimisation rates were recorded in the Northern Territory (124 per 100,000 people) and Western Australia (100 per 100,000 people)....The number of victims of sexual assault increased slightly (1.5%), rising from 14,353 victims in 1997 to 14,568 victims in 1998. [ABS, Recorded Crime Australia 1998, 16 June 1999]


Thursday 28 March 2024

Well now the Chicken Little's of Australian journalism have moved on to other topics, here is another perspective on that latest Newspoll


Well the headlines this week ran a particular pessimistic line.....


Fresh Newspoll suggests Labor spiralling towards minority government at next election in worst result since Voice defeat [Sky News, 25.03.24]


Newspoll: Labor on slide as new year reset fades [The Australian, 25.03.24]


Newspoll: Worst result for Albanese gov since referendum backlash [The Courier Mail, 25.03.25]


Federal Labor's Popularity Slips In Latest Newspoll [10Play, 25.03.25]


Voters’ harsh verdict on Labor as cost of living bites [The Daily Telegraph, 25 March 2025]


So what exactly did the latest Newspoll survey results show?


NEWSPOLL, Sunday 24 March 2024

Newspoll was conducted by YouGov from 18-22 March using a survey pool of 1,223 participants.


Federal Primary Voting Intent:

ALP 32 (-1)

L/NP Coalition 37 (+1)

Greens 13 (+1)

One Nation 7 (+1)

Other 11


Federal Two Party Preferred Prediction:

ALP 51 (-1)

L/NP Coalition 49 (+1)


Click on image to enlarge


Better Prime Minister:

Albanese 48 (+1)

Dutton 34 (-1)


Approval Rating

Anthony Albanese: Approve 44 (+1) Disapprove 51 (0)

Peter Dutton: Approve 37 (0) Disapprove 52 (+1)


By way of context


On 24 March 2024 the nation was 61 weeks out from the last possible date for next federal general election, 17 May 2025.


This 24 March the two party preferred outcome of 51-49 in Labor's favour mirrored past Newspolls on:


28 April, 5 & 12 May 2019

12 Jan, 23 Feb & 15 March 2020

25 April, 16 May & 27 June 2021.


In Newspoll on those same dates the Coalition had the higher primary vote on:


28 April, 5 & 12 May 2019

12 January, 23 February & 15 March 2020

25 April, 16 May & 27 June 2021.


With the 16 May 2021 Coalition primary vote lead being a 5 point advantage making it an identical voting intention & prediction poll with this week's 24 March 2024 poll.


At approximtely 61 weeks out from May 2022 federal election, Newspoll was showing a two-party preferred prediction outcome of 52-48 in Labour's favour and, a primary voting intention outcome of somewhere between 40-38 & 42-37 in the Coalition's favour by 2-5 points.


It would seem this is a road well travelled and this far out from an election gives no real indication of the mood of a national electorate in May 2025.


Wednesday 29 November 2023

Battle of the Political Opinion Polls November 2023


Two very different sources, two very different results, published two days apart - who does one believe?


Roy Morgan Research, Market Research Update, email, 28 November 2023:


Roy Morgan Poll on Federal voting intention shows support for the ALP recovering – up 3% points: ALP 52.5% cf. L-NP 47.5%


The ALP has regained the lead on 52.5% (up 3% on a week ago) ahead of the Coalition on 47.5% (down 3%) on a two-party preferred basis according to the latest Roy Morgan Poll on Federal voting intention conducted last week.


The result halts a run of three straight weeks of declines for the ALP.


On primary vote the Coalition is now on 35%, down 2.5% from a week ago, ahead of the ALP on 32%, up 2.5%. The Greens are unchanged on 13.5% and One Nation is on 5%, down 1.5%.


There has been a gain in support for Independents on 9%, up 2%, but a drop in support for Other Parties on 5.5%, down 0.5%.


The latest Roy Morgan Poll is based on interviewing a representative cross-section of 1,379 Australian electors from November 20-26, 2023.


The Australian, Latest Newspoll, 26 November 2023:


Newspoll Two Party Preferred results
10.02.19 to 25.11.23
Click on image to enlarge


Federal Primary Voting Intention:

ALP 31 (-4)

Coalition 38 (+1)

Greens 13 (+1)

One Nation 6 (no change)

Other 12 (+2)


Federal Two Party Preferred:

ALP 50 (-2)

Coalition 50 (+2)


Preferred Prime Minister:

Albanese 46 (no change)

Dutton 35 (-1)


Leaders Approval Rating:

Dutton: Approve 37 (no change) Disapprove 50 (no change)

Albanese: Approve 40 (-2) Disapprove 53 (+1)


Thursday 16 November 2023

Mapping Social Cohesion Report 2023 - 17th annual survey by Scanlon Foundation Research Institute - social cohesion in Australia has declined by 13 points since November 2020


"Trust in government and concern for inequality are contributing to a declining sense of national pride and belonging....Social cohesion has declined in almost all

domains over the last year." [Scanlon Foundation Research Institute, Mapping Social Cohesion Report 2023, pp. 8, 13]


Scanlon Foundation Research Institute, Mapping Social Cohesion Report 2023, Executive Summary, 14 November 2023:


Social cohesion in Australia has been remarkably resilient through the challenges of recent years. However, we continue to face difficult national and global circumstances, global conflict, economic pressures and uncertainty and division over issues such as the Voice referendum.


As a result – and while we remain connected – our social cohesion is under pressure and declining on some fronts.

Our sense of national pride and belonging has been

declining for some years, discrimination and prejudice

remain stubbornly common, while in more recent years,

we are reporting greater financial stress, increased

concern for economic inequality and growing pessimism for the future. However, in the strong connections we have in our neighbourhoods and communities and the way we increasingly embrace our differences and diversity, there is reason for optimism that we can respond collectively to the challenges we face and restore and strengthen our social cohesion.


Mapping Social Cohesion 2023


The Mapping Social Cohesion 2023 report comes

at a crucial time – a time to take stock and consider

the challenges ahead. In 2023, almost 7,500 people

participated in the Mapping Social Cohesion survey,

making it the largest survey in the series. As has been the case since 2018, the 2023 survey was administered to the Social Research Centre’s Life in AustraliaTM panel.


In preparing this year’s Mapping Social Cohesion report, we have taken extra steps to ensure we are reflecting the views of all Australians, particularly in view of our vast ethnic and cultural diversity. To do this, 251 targeted surveys were conducted with people from Indian, Middle Eastern and African backgrounds in four different languages (including English). We also conducted 55 in-depth qualitative interviews with people who have migrated to Australia over the years. This adds to the growing body of information on the attitudes and experiences of migrant Australians collected through the main Life in AustraliaTM survey, providing a greater, more in-depth and nuanced understanding than ever before.

More information on the surveys and interviews are

provided in the Appendix of this report.


Social cohesion in Australia is under pressure

and declining


In our 2022 report, we remarked that social cohesion

appeared to be at an important juncture. Our indicators

suggested that cohesion had been declining after a

COVID-related spike in 2020. While there were some

signs to suggest that cohesion was returning to a

pre-pandemic normal, declines in our sense of national

pride and belonging, increasing financial strain and a

weakening sense of social inclusion and justice were

warning signs of further weakening in our social fabric.

The results of Mapping Social Cohesion 2023 reinforce

these concerns and underline the precarious and

uncertain social environment of Australia in 2023.

In the last 12 months, the Scanlon-Monash Index of social cohesion declined by four points to 79, the lowest score on record. Since a peak in social cohesion during the COVID-19 pandemic in November 2020, social cohesion has declined by 13 points.


Read and download the full report at:

https://scanloninstitute.org.au/mapping-social-cohesion-2023


Sunday 29 October 2023

AUSTRALIAN SOCIETY: Counting Dead Women in 2023


@DeadWomenAus
26 October 2023


Based on media reports collected from 1 January to 26 October 2023 the Counting Dead Women project has recorded 41 violent deaths of females across Australia this year, at the hands of persons known to them. 


In the year to June 2023, according to the NSW Bureau of Crime Statistics and Research (BOCSAR), 15 of these violent deaths were recorded as murders occurring in New South Wales - one in the Northern Rivers region. 


In 2022 the Australian Bureau of Statistics (ABS) recorded 56 women and 11 girls under the age of 18 years murdered - a total of 67 violent deaths - and the attempted murder of another 43 women & girls.


The majority of these deaths appear to have occurred in residential properties.


In 2022 ABS recorded 19 women and girls in NSW as victims of homicide or related offences (murder, attempted murder, manslaughter).  Again, the majority appeared to have occurred in residential properties.  At least 10 of these deaths appear to have been classified as murder.  


SOURCES:

  • Destroy the Joint, Counting Dead Women project; 

https://twitter.com/DeadWomenAus

  • ABS, Victims of crime, Australia 2022, Tables 1-8 & 9-16National statistics about victims of a range of personal, household and family and domestic violence offences as recorded by police.

https://www.abs.gov.au/statistics/people/crime-and-justice/recorded-crime-victims/latest-release#australia

  •  NSW BOSCAR, Female Victims of Homicide (Murder) from July 2021 to June 2023

http://crimetool.bocsar.nsw.gov.au/bocsar/