Showing posts with label poll results. Show all posts

Friday 14 October 2022

Nine Entertainment-Fairfax Resolve Monitor opinion poll results concerning the major parties since the May 2022 federal general election


A walk through the opinions, expectations and intentions of those statistically being seen as representing the national electorate......


The first Nine Entertainment-Fairfax Resolve Monitor poll after the May 2022 federal general election was published on 21 August 2022.


In answer to the question “Regardless of who you would like to win the next federal election, who do you think will actually win?” respondents answered:


The Labor Party – 55%

The Liberal-Nationals – 15%

Undecided/Too close to call – 30%.


On 18 September 2022 the result of the identical question returned a response of:


The Labor Party – 51%

The Liberal-Nationals – 16%

Undecided/Too close to call – 33%.


While the latest result to that very same question on 9 October 2022 was:


The Labor Party – 55%

The Liberal-Nationals – 16%

Undecided/Too close to call – 29%.


Across those three poll periods sitting Prime Minister Anthony Albanese led Opposition Leader Peter Dutton as “Preferred Prime Minister”:


Albanese 55% to Dutton 17%

Albanese 53% to Dutton 19%

Albanese 53% to Dutton 18%.


Again, across those three poll periods, responses to the question Statements that might describe a party best – Is offering strong leadership” the response was:


21 August 2022

Labor48%

The Liberals 17%

Someone else8%

Undecided27%


18 September 2022

Labor – 45%

The Liberals – 19%

Someone else – 8%

Undecided – 29%


9 October 2022

Labor – 46%

The Liberals – 19%

Someone else – 9%

Undecided – 27%


Similarly over the three polling periods, respondents saw Labor leading the Liberals by a significant margin when it came to having a united team behind the leader, listening & focussed on the right issues and, communicating well.


As to the poll question on 9 October 2022 as to who was performing well in their respective rolls in recent weeks, respondents replied:


Albanese

Good to Very Good60%

Poor to Very Poor25%

Undecided15%


Dutton

Good to Very Good30%

Poor to Very Poor41%

Undecided28%


When it came to the question “Which party would you put number ‘1’ on the ballot paper?” the answers came back:


21 August 2022

ALP42%

LNP28%

GRN12%

OAP5%

UAP2%

IND8%

OTH3%


18 September 2022

ALP – 39%

LNP – 32%

GRN – 10%

OAP – 6%

UAP – 2%

IND – 8%

OTHER – 2%


9 October 2022

ALP – 39%

LNP – 30%

GRN – 12%

OAP – 5%

UAP – 3%

IND – 9%

OTHER – 2%


Sunday 25 September 2022

State of Play: New South Wales general election March 2023


The Sydney Morning Herald, 24 September 2022, excerpt:


The result, if replicated on March 25, would put Labor in majority government. The ALP needs to win at least eight seats to secure that majority.

Voters have also made it clear that the election will be fought on the rising cost of living, with 30 per cent identifying it as the No.1 issue of concern, while 10 per cent of voters singled out health and aged care, followed by the environment and climate change as well as economic management.

Despite the support for Labor, voters are not warming to either leader, with Premier Dominic Perrottet and Opposition Leader Chris Minns equal on the preferred premier rating.

Both are on 28 per cent (a slight drop for Minns from 32 per cent in February when he overtook Perrottet as preferred premier) but crucially, 44 per cent of voters are undecided…..


Read full article here.


Wednesday 20 April 2022

Australian Federal Election 2022: it seems we live in interesting times.


IMAGE: The Australian, 18 April 2022
Click on image to enlarge


Another Newspoll was published by The Australian on 18 April 2022.  


The results were as follows......


Survey of Federal Election Voting Intentions


First Preference:


Labor – 36% (down 1 on10 April poll)

Coalition – 35% (down 1 on10 April poll)

Greens – 12% ( up 2 since10 April poll)

One Nation – 4% (up 1 since 10 April poll)

United Australia Party – 4% (no change since10 April poll)

Others – 9% (down 1 since 10 April poll)


Two Party Preferred:


Labor 53% (no change since 10 April poll)

Coalition 47% (no change since 10 April poll)


Better PM:


Scott Morrison44% (no change since 10 April poll)

Anthony Albanese37% (down 2 since 10 April poll)

Undecided19% (up 2 since 10 April poll)


Satisfaction with Leaders Performance:


Scott MorrisonSatisfied 43% (up 1), Dissatisfied 52% (down 2) & Uncommitted est. 5%

Anthony Albanese – Satisfied 37% (down 5), Dissatisfied 51% (up 6) & Uncommitted est. 12%


Net Satisfaction with Leaders Performance:


Scott Morrisonminus 9% (up 3)

Anthony Albaneseminus 14% (down 11)


On the basis of the two party preferred percentage points if an election had been held between 14-17 April 2022 then Labor would have won government, with possibly 80 seats in the House of Representatives to the Coalition’s 65 seats. This is the same outcome predicted by the Newspoll results of 6-9 April, but markedly less favourable to Labor than the Newspoll survey results of  31 March-3 April.


Resolve Strategic-9 Entertainment released the results of a limited voter intention survey on Sunday 17 April 2022, which had primary voting intention coming in at Coalition 35% to Labor 34%. Poll Bludger ran the 2019 Two Party Preferred data against those percentages & the outcome went Labor 52% to Coalition 48%. Which means that if an election had been held between 11-16 April Labor would likely have won with 9 seat lead in the House of Representatives. This was somewhat awkward for those editors, commentators & journalists who had initially been predicting an outright win for Morrison on the basis of that particular survey.


Newspoll results show the Morrison Government losing ground since 27 June 2021 and Labor in positive Two Party Preferred territory across the same period. Enthusiasm for Scott Morrison as “Preferred PM” has been gradually falling since 21 February 2021 but Anthony Albanese has been lagging behind Morrison on this particular indicator in all but one Newspoll during the same period. In itself “Preferred PM” is not a stand alone indicator of success at a federal election and party leaders do go on to win government will less than stellar approval numbers.


However, mainstream media is reporting a record number of “Independent” candidates registering for the coming federal election and, on social media platforms there is some anecdotal evidence of strong support for such candidates and for The Greens. If predictive percentages tighten ahead of election day, this support may translate into more than 6 House of Representative seats going to Independents/minor parties and it is possible that neither of the two major parties will achieve an outright majority at the 21 May federal election. 


Four of these independent candidates have stated a willingness to enter into talks with Scott Morrison if citizens' ballot papers do not deliver him a clear majority - 51.5% of the national vote. These candidates are; Zoe Daniel (Ind Goldstein Vic), Allegra Spender (Ind Wentworth NSW), Sophie Scamps (Ind Mackellar NSW) and Kate Chaney (Ind Curtin WA). 


It seems we are living in interesting times.


Monday 11 April 2022

Last Newspoll before 2022 federal general election was announced


Newspoll published on The Australian on 10 April 2022. Based on YouGov survey of 1,506 respondents conducted between 6 and 9 April.


RESULT


First Preference


Labor – 37% (-1)

Coalition – 36% (0)

Greens – 10% (0)

United Australia Party – 4% (+1)

One Nation – 3% (0)

Others10%


Two-Party Preferred 4 February 2018 to 10 April 2022


Click on image to enlarge


Two-Party Preferred 6-9 April 2022


Labor – 53% (-1)

Coalition – 47% (+1)


Based on Anthony Green’s Election Calculator this Two-Party Preferred result would see a 4.4% swing to Labor with 80 seats won (a gain of 11 seats) to Coalition with 65 seats won (a loss of 11 seats) and Minor Parties/Independents with 6 seats won - after factoring in retiring and sophomore MPs.


Preferred PM


Morrison (Coalition) – 44 (+1)

Albanese (Labor) – 39 (-3)

Uncommitted17 (+2)


Leaders Performance


Albanese – Approve 42 (-1) Disapprove 45 (+1)

Morrison Approve 42 (0) Disapprove 54 (0)


Note:

Survey margin of error is ±2.5%


Comparing the Polls


IMAGE: 9 News, 10 April 2022
Click on image to enlarge


Monday 31 January 2022

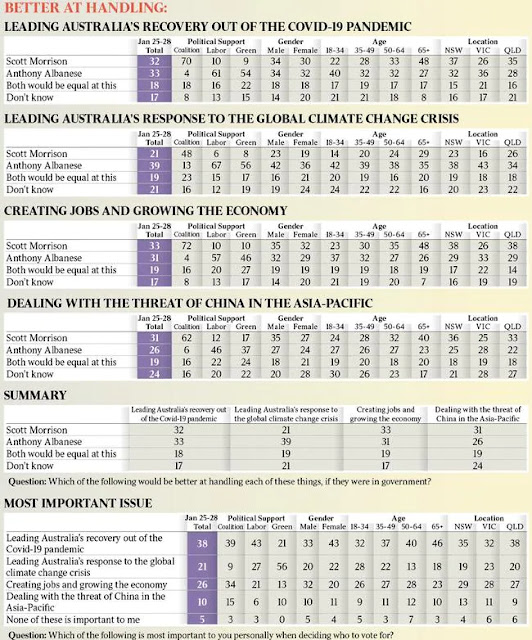
First Newspoll for Australian federal election year 2022 - questions concerning leadership


Newspoll,  survey conducted Tuesday 25 to Friday 28 January 2022 from a sample of 1,526 respondents


News.com.au, 30 January 2022:


Prime Minister Scott Morrison’s government is fighting for political life according to Newspoll with popular support plunging to the lowest levels since the 2018 leadership change.


After a horror summer marked by rising Omicron cases, hundreds of deaths and fury over a shortage of rapid antigen tests, voters have turned on the government with a sharp drop in support.


The Prime Minister is expected to hold an election in May. While March remains an option, today’s Newspoll is unlikely to prompt the PM to go to the polls anytime soon.


According to Newspoll, Labor’s primary vote lifted three points to 41 per cent, it’s highest result since 2018.


For the first time, the Coalition is also behind Labor on the question of which party is deemed better at leading Australia’s recovery out of Covid-19.


In the first Newspoll of 2022, support for the Prime Minister has been smashed with the combined Liberal-Nationals primary vote falling two points to 34 per cent.


On a two-party-preferred basis, Newspoll delivers Labor a winning margin of 56-44 – the largest margin for the opposition since the leadership change in September 2018.


Labor would wipe-out the Morrison Government’s majority if those results are replicated at the election with the potential loss of up to 25 seats and a landslide victory.


This is the worst Newspoll result for the Liberal Party since September 2018 and is worse than previous plunges in support after revelations of his secret Hawaii holiday during the 2019 bushfires, Brittany Higgins allegations in 2021 and anger over the vaccine rollout......


Saturday 29 January 2022

A picture is worth a thousand words in an election year


Essential Research uses statistical analysis to examine, interpret and report on survey data which is collected via a fortnightly online omnibus active from the Wednesday night of each week and closing on the following Sunday. The target population is all Australian residents aged 18 of age and older. Participants are invited to participate and completed the survey online without an interviewer present and incentives are offered for participation. The response rate varies each week, but usually delivers 1,000+ interviews. Quotas are applied to be representative of the target population by age, gender and location. 


This is one of the graphs contained in the Essential Report published on Tuesday, 25 January 2022 - in response to the survey question asked on 24 January: "Overall, how would you rate the federal government’s response to the Covid-19 outbreak?" 


The percentage breakdown was 35% of all survey respondents thought the Morrison Government had done "Quite/Very Good" and 38% of all survey respondents thought the Morrison Government has done "Quite/Very Poor".


Broken down by state, the percentage of respondents who answered that question favourably had fallen across all states since 13 December 2021, with the exception of Queensland where the number of survey respondents who thought their state government had done "Quite/Very Good" rose 3 percentage points to 46% on 24 January 2022.


Wednesday 22 December 2021

New Clarence Valley councillors have been declared, December 2021


After 14 counts of all ballots cast in the Saturday 4 December 2021 Clarence Valley local government election, the final count was posted on 20 December.


Candidate(s) marked with an asterisk were elected without reaching quota.
 
Candidates elected at the same count are displayed in the order they appear on the ballot paper.


The margin between the last elected candidate TOMS Karen and the last un-
elected/excluded candidate ELLEM Peter is 137.


Voter enrollment at this December 2021 election was 38,544. A total of 33,019 ballot papers were received of which 30,661 were counted a formal votes.


Jeff Smith and Debrah Novak were elected on first preference and the other seven councillors after the distribution of preferences.


SEE: 

https://vtr.elections.nsw.gov.au/LG2101/clarence-valley/councillor/report/candidates-in-sequence