Showing posts with label statistics. Show all posts

Friday, 25 October 2024

In 2024 road fatalities in NSW rural & regional areas continue to outnumber those in metropolitan areas - at least 24 of these deaths occurred in the Northern river region


In 2024 from 1 January through to 23 October Transport NSW preliminary road fatality data recorded 245 fatal vehicle crashes across the state which caused 273 deaths - 20 of which occurred in the first 23 days of October.


The number of drivers killed outnumbered the combined total of passengers, pedestrians, motorcyclists & cyclists (139 to 134). While males far out number females among the dead (217 to 56). The largest road fatality by age cohort was the those 70 years of age and older.


Fatalities in country areas continue to outnumber those in metropolitan areas - 181 deaths on rural and regional roads compared to 92 deaths on metropolitan roads.


Up to the end of September this year the Australian Road Deaths Database revealed that NSW road fatalities included 24 deaths on Northern Rivers roads:


Clarence Valley - 8 people

Ballina Shire - 5 people

Tweed Shire - 4 people

Richmond Valley - 3 people

Lismore City - 3 people

Byron Shire - 1 person

Kyogle Shire - 0 persons.


Sunday, 4 August 2024

NSW road fatalities in 2024 are way too high for humans and rising too quickly for wildlife in this state


It will probably come as no surprise that in 2024 to 1st August the NSW Road Toll Statistics showed 208 fatalities predominately on regional roads. 


With more fatalities being drivers of a vehicle, more male than female fatalities and, the age group which consistently has the highest number of road fatalities is the 70+ years. [Transport NSW, June 2024] 


Sadly, New South Wales is not having much success at lowering the number of road fatalities to date.


What you may not know is that when it comes to reported wildlife fatalities on New South Wales roads over the same period, the death toll is conservatively estimated to be in the vicinity ten thousand and rising


With the drivers of the vehicles involved in collisions with an animals most likely to be middle aged males, (between 45-54, followed closely by 55-64), possibly driving a Toyota Landcruiser, Toyota Hilux, Ford Ranger, Toyota Corolla or Holden Commodore. [AMMI, August 2024]


Click on tables and graph to enlarge


SEE: https://www.transport.nsw.gov.au/system/files/media/documents/2024/nsw-road-toll-daily-20240802-2.pdf


AAMI, media release, 6 June 2024, excerpts:


Animal collisions have increased by 22 per cent year-on-year according to new claims data from national insurer AAMI....


- New alarming research from AAMI found more than 40 per cent of Aussie drivers don’t pay attention to wildlife warning signs....


- More than half (54 per cent) of Aussie drivers have been involved in an animal collision, with the majority of these occurring on rural and regional roads.....


NSW is the most dangerous state for wildlife collisions (30 per cent), followed by VIC (29 per cent) and QLD (24 per cent). In the previous two years, VIC was the most dangerous, followed by NSW and QLD.


- Dubbo in New South Wales holds the dubious title of Australia’s worst animal collision hotspot, followed by Sunbury in Victoria and Goulburn in New South Wales.


- The animal species involved in most crashes are; kangaroos, wallabies, wombats, deer, dogs, cows, emus, pigs, fox and rabbit*.


- In Australia, the cooler months are the worst time of year for animal collisions, with more than a quarter (28 per cent) of road accidents involving wildlife taking place between June to August. Almost 60 per cent (58 per cent) of all animal collisions occur between May and October.


- Dusk is the most dangerous time for animal collisions, with a quarter of accidents occurring from 4:30pm- 8pm.


- Animal collisions can be costly, with the average cost of an insurance claim greater than $5,000.


- In around 16 per cent of claims involving an animal in the last year alone, the damage to the vehicle was so severe, the car was written off.


- Saturday is the worst day of the week for wildlife related road accidents – with almost one third (31 per cent) of incidents taking place over the weekend (Saturday and Sunday).


  • Male drivers and those middle aged (between 45-

54, followed closely by 55-64) are most likely to find

themselves in a collision with an animal.


  • Cars most likely to be involved in an animal collision are:

Toyota Landcruiser

Toyota Hilux

Ford Ranger

Toyota Corolla

Holden Commodore


White vehicles, followed by grey and silver are most likely to collide with an animal.


Thursday, 11 July 2024

So how are we all feeling about life right now? *a rhetorical question*


via X/Twitter 10.07.24


So how are we all feeling today? Short answer is — nobody knows for sure what Australia's collective mood is.


However the statisticians tell us that most of us feel out families are "worse off" than they were last year and are not expecting to see "good times" anytime soon.


Many of us are still in the dumps about the cost of living. We are not spending up big and that is reflected in business turnover.


We are doing what Aussies always do in tough times — we gamble a little bit more chasing the rainbow of a home of our own or a car that isn't falling to bits. 


Low income families are sometimes having to borrow from family or friends to meet household utility bills, despite small government subsidies for residential electricity.


While the average Internet subscriber is still spending 10 hours a week on entertainment streaming services, it seems quite a few people are now switching to advertising-supported content streaming as a way to shave a few dollars off the weekly budget.


When it comes to looking at economic activity and consumer confidence statisticians rarely mention homelessness or food poverty. The sad fact is that homelessness, housing insecurity and food insecurity are as entrenched as they have ever been and are exacerbated by the sustained rising prices we have experienced for the last two years.


However, Australians statisticians are generally a grounded mob making measured comment. So after reading their reports no-one is yelling from their bedroom windows that the national economic sky is falling on our heads — except Peter Dutton.


Australian Bureau of Statistics media release published 10 July 2024:


Reference period: May 2024


Business turnover in trend terms rose 0.2 per cent in May according to figures released today by the Australian Bureau of Statistics (ABS).


Robert Ewing, ABS head of business statistics, said: “The pattern we have seen in recent months continues as the business turnover 13-industry aggregate remained flat in May.


In seasonally adjusted terms, most industries either fell or were flat which resulted in the 13-industry aggregate falling 0.6 per cent.


Softening the fall, we saw larger rises in Arts and recreation, up 2.8 per cent, and Information media and telecommunications, up 2.6 per cent.”


The Arts and recreation growth was driven by an increase in gambling activity. Information media and telecommunications was driven by the Publishing (except internet and music publishing) subdivision as demand for generative artificial intelligence continues to grow.


While over at Roy Morgan Research om 9 July 2024:


Finding No. 5920


ANZ-Roy Morgan Consumer Confidence drops 2.3pts to 79.0 after End of Financial Year (EOFY) sales finish up; buying sentiment indicator has largest weekly drop so far this year


ANZ-Roy Morgan Consumer Confidence dropped 2.3pts to 79.0 this week after the End of Financial Year (EOFY) Sales period finished at the end of June after the buying sentiment indicator suffered its biggest weekly decline so far this year – down a net 9% points from a week ago.


Looking longer-term, Consumer Confidence has now spent a record 75 straight weeks below the mark of 85 and is a large 5.7 points above the same week a year ago, July 3-9, 2023 (73.3), but is now 2.8 points below the 2024 weekly average of 81.8.


A look at Consumer Confidence by State shows the index was down in New South Wales, Victoria, Western Australia, and South Australia but virtually unchanged in Queensland.


Views on personal finances compared to a year ago were slightly worse off this week while views on the Australian economy’s performance going forward were virtually unchanged.


Current financial conditions

Now under a fifth of Australians, 19% (down 1ppt), say their families are ‘better off’ financially than this time last year compared to 53% (up 3ppts) that say their families are ‘worse off’.


Future financial conditions

However, views on personal finances over the next year were virtually unchanged this week, with under a third of Australians, 31% (unchanged) expecting their family to be ‘better off’ financially this time next year while another 35% (down 1ppt) are expecting to be ‘worse off’.


Short-term economic confidence

In addition, only 8% (unchanged) expect ‘good times’ for the Australian economy over the next twelve months compared to 36% (down 1ppt), that expect ‘bad times’.


Medium-term economic confidence

Net sentiment regarding the Australian economy in the longer term was virtually unchanged this week with 12% (up 1ppt) of Australians expecting ‘good times’ for the economy over the next five years compared to just over a fifth, 21% (up 1ppt), expecting ‘bad times’.


Time to buy a major household item

  • There was a big dip to net buying intentions this week after the End of Financial Year (EOFY) Sales finished up with just over a fifth, 21% (down 4ppts), of Australians saying now is a ‘good time to buy’ major household items (the biggest drop for this indicator so far this year) while a majority of 51% (up 5ppts) say now is a ‘bad time to buy’ major household items (the largest increase for this indicator so far this year).


  • The net result was a movement of 9ppts towards ‘bad time to buy’, the biggest net move down for this indicator for nearly 18 months since early February 2023 after the Reserve Bank raised interest rates for the first time in 2023.


ANZ Economist, Madeline Dunk, commented:

"ANZ-Roy Morgan Australian Consumer Confidence dropped to its second lowest level for the year. The decline was driven by a 9.0pt fall in the ‘time to buy a major household item’ subindex, following the conclusion of end-of-financial year sales. This was the largest weekly fall in the subindex since February 2023. There was also a 4.7pt drop in ‘current financial conditions’.


Across the housing cohorts, confidence declined most for those paying off a mortgage, perhaps due to talk about the possibility of an RBA rate hike in August. Confidence also fell for households that own their homes outright, while it was broadly stable for renters."


Monday, 8 July 2024

After 1,700 women were murdered by an intimate partner in the last 34 years & 8 months up to March 2024, finally an Australian Government creates an accessible public record of such deaths


For the last 34 years and 8 months an average 4 women a month have been murdered by a current or former intimate partner.


Finally an Australian federal government has moved to make an easily accessible public record of such deaths. 


In large measure as a response to women from Destroy The Joint who, by a sustained monthly recording of all females mentioned in the media after dying a violent death from September 2012 onwards, kept a spotlight on the issue of lethal violence against women and girls.


Counting Dead Women 
a Destroy the Joint project


Eight women were killed in June alone, three in as many days and 17 more women have been killed than at this same time last year. [ABC News, 1 July 2024]


NSW Police News:


UPDATE:Fatal house fire - Lalor Park

Sunday, 07 July 2024 05:11:32 AM


A man is in custody following a fatal house fire in Sydney’s west.


About 1am today (Sunday 7 July 2024), emergency services were called to Freeman Street, Lalor Park, following reports of a house fire.


On arrival of emergency services, one nine-year-old girl and three boys aged eleven, seven and six were treated at the scene by NSW Ambulance Paramedics and taken to Westmead hospital in stable condition.


Two boys – aged two and four – were treated at the scene by NSW Ambulance paramedics and taken to Westmead Hospital in a critical condition; however, they died a short time later.


Fire and Rescue NSW extinguished the fire before a third child – believed to be a 10-month-old girl – was found deceased.


The three children are yet to be formally identified.


A 29-year-old woman has been taken to hospital for smoke inhalation.


Officers attached to Blacktown Police Area Command arrested 28-year-old man at the scene; he was treated for smoke inhalation and taken to hospital under police guard.


Police have commenced an investigation into the circumstances surrounding the incident.


A report will be prepared for the information of the Coroner.


Anyone with information about this incident is urged to contact Crime Stoppers: 1800 333 000 or https://nsw.crimestoppers.com.au. Information is treated in strict confidence. The public is reminded not to report information via NSW Police social media pages. [My yellow highlighting in article]


Det Supt Danny Doherty described the circumstances as “incredibly tragic”. He alleged that a 28-year-old man arrested at the scene attempted to prevent police and emergency services from rescuing those inside the home. The man is the father of the deceased children, police confirmed. [The Guardian, 7 July 2024]


Homicide in Australia


Intimate partner homicide dashboard (data commencing 1 January 2024 & updated quarterly) can be found at:

https://www.aic.gov.au/statistics/homicide-in-australia


Friday, 5 July 2024

By 3 July in 2024 there were 644,633 instances of communicable diseases recorded in Australia - 75.83% of which were respiratory diseases (with COVID-19 leading the respiratory numbers)


ScienceOpen, Zoonoses, Volume 4, Issue 1:


GlobalInfectious Diseases between January and March 2024: Periodic Analysis


Tingting, J. et al, published 21 May 2024


FIGURE 1 | Worldwide distribution of infectious diseases from January to March 2024.


In the past 3 decades, >40 previously unidentified infectious diseases have emerged globally. This emergence, coupled with accelerated urbanization, advancing transportation networks, climate change, and global population aging, has led to the rapid spread and increased recurrence of infectious diseases worldwide. Consequently, these phenomena pose a significant threat to public health and safety, while profoundly impacting economic and social development.


As a result, the effective prevention and control of newly emerging infectious diseases have become pressing imperatives for humanity. Simultaneously, bolstering research efforts aimed at preventing and treating emerging infectious diseases remains an ongoing pursuit within the medical domain, encapsulated by the adage, “with greater knowledge comes greater challenges.” It is an unequivocal responsibility for healthcare practitioners to diligently explore timely and efficacious methods and strategies for preventing and treating newly emerging infectious diseases.


The Australian Government Dept. of Health Surveillance Dashboard (listing 9 major disease groups & updated 3 July 2024) records that to date in 2024 there have been 644,633 instances of confirmed communicable diseases in Australia.


With the highest numbers found in the Respiratory Diseases Group with a total of 488,848 confirmed instances across 6 named diseases:


COVID-19 209,532 cases

Influenza (laboratory confirmed) 53,014 cases

Legionellosis (Legionnaires' disease) 347 cases

Pertussis (Whooping Cough) 12,383 cases

Respiratory syncytial virus (RSV) 112,891 cases

Tuberculosis 711 cases.


Note: In the year to 22 June 2024 the Northern NSW Local Health District recorded:

2,406 confirmed cases of COVID-19;

680 confirmed cases of Influenza;

1,063 confirmed cases of RSV; and

To date the area health service has not issued a specific Pertussis alert for the Northern Rivers region this year.


The Surveillance Dashboard group with the second highest numbers was Gastrointestinal diseases with a total of 41,169 confirmed instances across 13 named diseases.

While the group with the third highest numbers was Sexually transmissible infections with a total of 81,088 confirmed instances across 4 named diseases.

The group with the fourth highest numbers was sadly Vaccine preventable diseases with a total of 20,487 confirmed instances across 13 diseases.


The only communicable diseases on the Surveillance Dashboard not listed as occurring from 1 January to 3 July 2024 are Donovanosis, Poliovirus infection, Rubella congenital, Tetanus, Japanese encephalitis virus infection, Anthrax, Australian bat lyssavirus infection & Tularaemia.


The highest number of communicable disease notifications to date originated from New South Wales (263,628), Queensland (138,625) and Victoria (116,788). These three states making up a combined est. 80.51% of all notifications.


MORTALITY


From 2022 to 2024 COVID-19 has been the leading cause of acute respiratory infection mortality in Australia, totally 21,158 deaths with more males dying from COVID-19 compared to females.

There were est. 1,367 COVID-19 deaths between 1 January and 31 May 2024 - 626 females and 741 males.

There were also 152 recorded deaths from Influenza with more males than females having died from influenza in 2024. Additionally, a total of 114 deaths were recorded from RSV in 2024.


Sunday, 26 May 2024

Suicide is a distressing subject and one that is linked in many kitchen table conversations with Centrelink income support programs. It appears that such a link may exist


The Guardian, 22 May 2024:


More than 30% of people who took their lives in 2019 were on welfare, AIHW says


The Australian Institute of Health and Welfare has just released some data that shows more than 30% of suicides in 2019 were people on the disability support pension (DSP) and newstart – despite being just 5.7% of the population.


During 2019, the most recent pre-Covid pandemic year, the age-standardised suicide rate among males who received unemployment payments was 2.8 times that of the male Australian population comparison. For females, it was 3.3.


During the same year, unemployment recipients accounted for approximately 20% of all suicide deaths among Australian males and females (across the same age range 15-66 years). Those on DSP were 14.5%.


The DSP recipient and Antipoverty Centre spokesperson, Kristin O’Connell, said:


The new figures on welfare recipient deaths by suicide are chilling, but reflect my all-too-frequent experiences supporting people who are planning to or have made an attempt as a result of dealing with “mutual” obligations or poverty.


Every government decision to leave us in poverty and subject people to abuse through “mutual” obligations is a decision that kills.


In 2020, Australia’s Mental Health Think Tank said the fastest and most effective thing the government could do to ease the mental health crisis was to keep the jobseeker payment at the poverty line.


The Morrison government plunged people back into deep poverty, and despite their claims to offer “cost of living relief” the Albanese government has continued the brutal welfare policies that led to these alarming suicide rates and widespread harm in our communities.


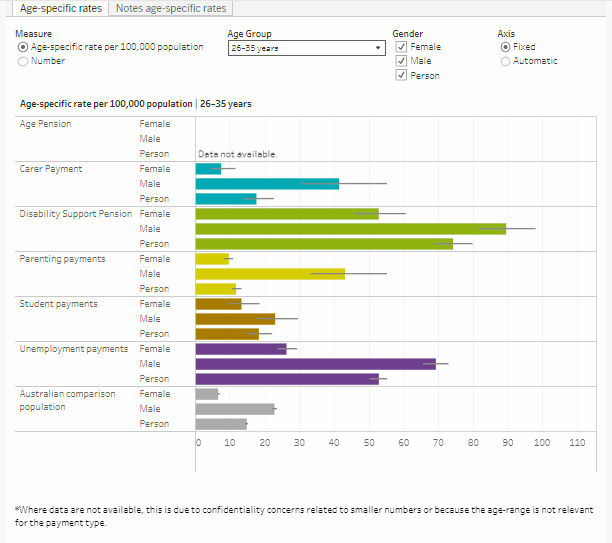
The wider picture also supports the assertion that welfare recipients of workforce age as a cohort are experiencing higher levels of suicide than the Australian population and, within that cohort those receiving disability or unemployment income support show the highest suicide rates. With a higher suicide rate than the general population continuing into old age for those receiving disability income support.


Australian Institute of Health and Wellbeing, Suicide & self-harm monitoring, Supporting people who experience socioeconomic disadvantage: Deaths by suicide among Centrelink income support recipients, retrieved 22 May 2024:


Age-specific rates of suicide among those who received income support payments between 2011 and 2021


Click on images to enlarge


AIHW, 15 August 2023:


Deaths by suicide, by socioeconomic areas


 From 2001 to 2022, age-standardised suicide rates were highest for those who lived in the lowest socioeconomic areas (most disadvantaged areas), and generally decreased as the level of disadvantage lessened.


In 2022, the suicide rate for people living in the lowest socioeconomic (most disadvantaged) areas (18.4 deaths per 100,000 population; Quintile 1) was more than twice that of those living in the highest socioeconomic (least disadvantaged) areas (8.2 deaths per 100,000 population; Quintile 5). Similarly, the number of deaths by suicide generally declined as socioeconomic disadvantage decreased.


Overall, age-standardised suicide rates increased for those living in the lowest socioeconomic areas (Quintile 1); from 14.0 deaths per 100,000 population in 2001 to 18.4 deaths per 100,000 population in 2022. In contrast, smaller change was observed for those living in the higher socioeconomic areas (Quintiles 4 and 5). [my yellow highlighting]


The Coronavirus Supplement was introduced in April 2020 and abolished in April 2021. Then COVID-19 Disaster Payments were announced in June 2021 and withdrawn in November 2021 placing increased financial stress on up to 2 million people. The Reserve Bank Cash Rate Target began to rise on 4 May 2022 and kept on rising - swiftly exacerbating a cost-of-living squeeze into an escalating crisis.


Although the causes of individual suicides can be complex, it is hard to resist seeing an economic policy correlation with the rising suicide rate between 2021 and 2022. It is also hard to avoid viewing entrenched poverty as being heavily influenced by federal income support policy decisions.


Monday, 13 May 2024

Fifth Annual NSW Statewide Street Count of homeless people sleeping rough - results for the Northern Rivers region from Clarence Valley to the NSW-Qld border


TheEcho, 10 May 2024:


Byron Shire topped the state with a 16 per cent increase in rough sleepers, but the count also showed significant increases in numbers across Tweed, Ballina and Lismore shires.


While Sydney has remained stable with a one per cent increase it is the regional areas experiencing the biggest surge in homelessness in the past year. The 2024 street count found 2,037 people sleeping rough in 2024 compared to 1,623 people last year.


The sobering street count figures again paint a harrowing picture of homelessness and street sleeping across our state.,’ said Minister for Homelessness Rose Jackson.


While levels of street sleeping have stabilised in Sydney, we are still seeing an unprecedented increase of homelessness in many of our regional towns. We don’t just need data to tell us this – our regional communities are feeling this every day.’


The impact of climate disasters like the 2019-20 Black Summer bushfires, the 2022 floods, the rising interest rates, cost of living pressures and a shortage of rental homes are just some of the factors that are continuing to drive homelessness and street sleeping.


It is important to note that these are just the people sleeping on the street and in their cars, they do not reflect the number of people who are homeless and for example are staying with family or sleeping on friend’s couches etc.


Lismore saw an increase of rough sleepers jump from 40 in 2023 to 64 in 2024. Tweed Valley went from 145 to 174 in 2024, Ballina went from 30 to 63 and Byron Shire went from 300 to 348.....


Read the full article at:

https://www.echo.net.au/2024/05/byron-shire-sees-biggest-increase-in-rough-sleepers/


According to NSW Government Communities & Justice, 2024 NSW Statewide Street Count: Technical Paper, published on 8 May 2024:


Street counts took place between 1 February and 1 March 2024, in more than 400 towns and suburbs in 76 local government areas (LGA) across NSW.


Half of the counts took place in the evening, scheduled between 10:00pm and 3:00am, with the remaining half occurring in the morning between 3:30am and 9am.


Over 300 local organisations either consulted in the planning phase or participated in the delivery of street counts. Partners included Community Housing Providers, local councils and Specialist Homelessness Services, as well Aboriginal organisations, Local Health Districts, local community groups, and Police.


In 2024 in the Northern Rivers region local government areas (LGAs) with the largest decreases in people sleeping rough were:


Richmond Valley - 3 rough sleepers as of 22.02.24 at 5 locations. Down from 19 persons in 2023.

Clarence Valley - 58 rough sleepers as of 20.02.24 at 6 locations. Down from 69 persons in 2023.


As for the other five LGAs:


Kyogle Shire - had no rough sleepers as of 23.02.24 and zero persons in 2023

Ballina Shire - 63 rough sleepers as of 28.02.24 at 6 locations. Up from 30 persons in 2023

Lismore City - 64 rough sleepers as of 23.02.24 at 5 locations. Up from 40 persons in 2023

Tweed Valley - 174 rough sleepers as of 27.02.25 at 15 locations. Up from 145 persons in 2023

Byron Shire - 348 rough sleepers as of 29.02.24 at 9 locations. Up from 300 persons in 2023.


Across all 400 NSW sites counted in February 2024 there were 2,037 people considered homeless and sleeping rough. This represents a 26 per cent (414 person) increase compared to 2023.


Thursday, 25 April 2024

North-east NSW coastal waters since 1850: a 'hot spot' for shark numbers


There are 8 real-time, satellite-linked VR4G listening stations deployed in approximately 10 to 12 metres depth of water approx. 500 metres offshore along the stretch of coastal waters off the Northern Rivers region in north-east New South Wales.


These listening station buoys are located at:

Kingscliff Beach, Tweed Heads

Clarkes Beach, Byron Bay

Lennox Point, Lennox Head

Sharps Beach, Ballina

Lighthouse Beach, Ballina

Main Beach, Evans Head

Main Beach, Yamba.


VR4G listening station off Lighthouse Beach, Ballina

IMAGE: NSW DPI Shark Smart


In 2023 the total number of shark detections at each of these 8 listening buoys were:

Kingscliff Beach - 305 (302 Bull Sharks & 3 White Sharks)

Clarkes Beach - 409 (213 White Sharks & 196 Bull Sharks)

Lennox Point*         | These 3 sites combined

Sharps Beach*        | 2,026 detections of

Lighthouse Beach* | 1,175 Bull, 755 White & 116 Tiger sharks

Main Beach, Evans Head - 3,135 (3,031 Bull Sharks & 96 White Sharks)

Main Beach, Yamba - 17,501 (17,306 Bull Sharks, 103 White Sharks & 2 Tiger Sharks).


Although in 2023 Yamba might have been the main contender for the title of shark capital of New South Wales, particularly in the months of April to August, there have been zero fatal shark attacks in Yamba river or ocean waters since 1850 and, only 37 injuries resulting from contact with a shark recorded by the Australian Shark Incident Database in that same 174 year period.


As for the entire coastline of north-east NSW along with its saltwater river mouths, from the Clarence Valley up to the NSW-Qld border, there have been est. 361 interactions with sharks resulting in injury since 1850, including est. 37 deaths.

Monday, 22 April 2024

Newspoll April 2024 sees little wind in political parties' sails


Federal Primary Voting Intent:


ALP 33 (+1)


L/NP Coalition 38 (+1)


Greens 12 (-1)


One Nation 7 (0)


Other 10 (-1)


Federal Two Party Preferred Prediction:


Click on image to enlarge


ALP 51 (0)


L/NP Coalition 49 (0)


Better Prime Minister:


Click on image to enlarge


Albanese 48 (0)


Dutton 35 (+1)


Net Approval Rating


Anthony Albanese:  -6 (+1) 


Peter Dutton:  -15 (0) 


Newspoll was conducted by YouGov on Monday 15 to Friday 19 April 2024 and survey pool was 1,236